
【Data Interpreter】Devinをも凌ぐMetaGPTのデータ分析AIエージェント
WEELメディア事業部LLMリサーチャーの中田です。
3月14日、最先端のオープンソース自律型エージェント「Data Interpreter」を、MetaGPTが公開しました。
このツールを用いることで、以下のように「NVIDIAの株価予測のためのPythonコーディング」を簡単に行えるんです!
公式Xでの投稿のいいね数は、すでに1300を超えており、あのDevinにも迫りそうな勢いで注目されていることが分かります。
この記事ではData Interpreterの使い方や、有効性の検証まで行います。本記事を熟読することで、Data Interpreterの凄さを理解し、Devinには戻れなくなるでしょう。
ぜひ、最後までご覧ください。
\生成AIを活用して業務プロセスを自動化/
Data Interpreterの概要
Data Interpreterとは、データ解析関連のタスクを解決するためのコードを書くAIエージェントです。ユーザーが自然言語で指示を出すと、それに基づいてData Interpreterが計画を立て、実行するためのコードを書き、必要に応じてnotebookやshellなどのツールを勝手に使用しながら、自律的にタスクを実行してくれます。
開発元のMetaGPTも、公式Xで「新しいプログラミング言語は英語だ」と述べています。また、大胆にもData Interpreterを「Devinよりも優れたオープンソースのAIエージェント」と表現しています。
ちなみに、Data Interpreterを利用してできるタスクには、以下のようなものがあります。
- 株価の分析・予測
- ウェブサイトの模倣
- 機械学習モデルの学習
- レシートを使ったOCR
その他、具体的な応用例については、Data InterpreterのExamplesページを参考にしてください。
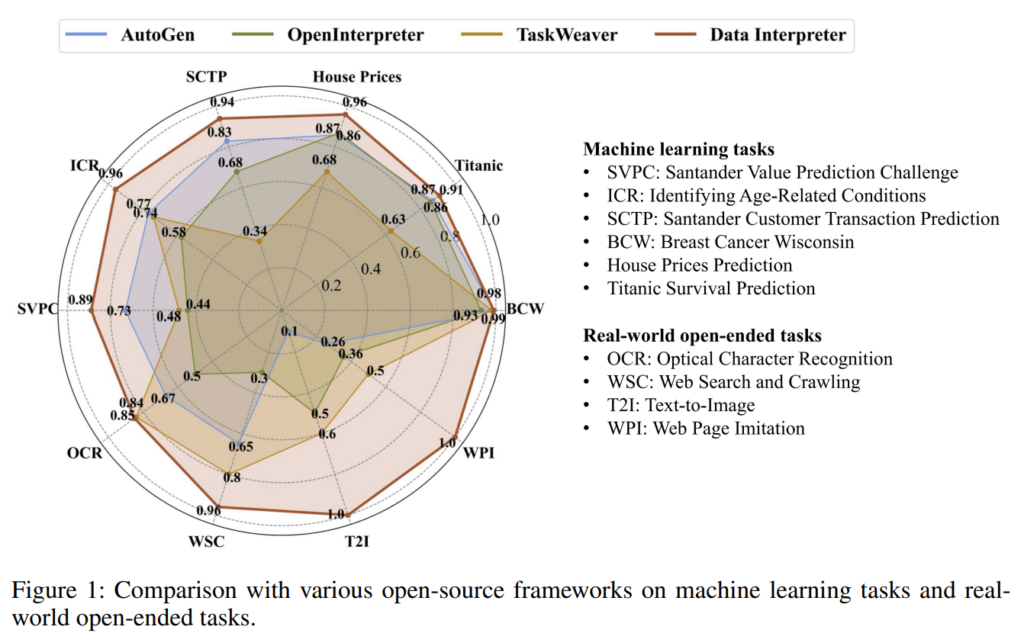
性能に関しては公式の論文によると、機械学習などのタスクにおいて、その他のオープンソースのAIエージェントと比べた時、Data InterpreterはSOTAを達成したそう。
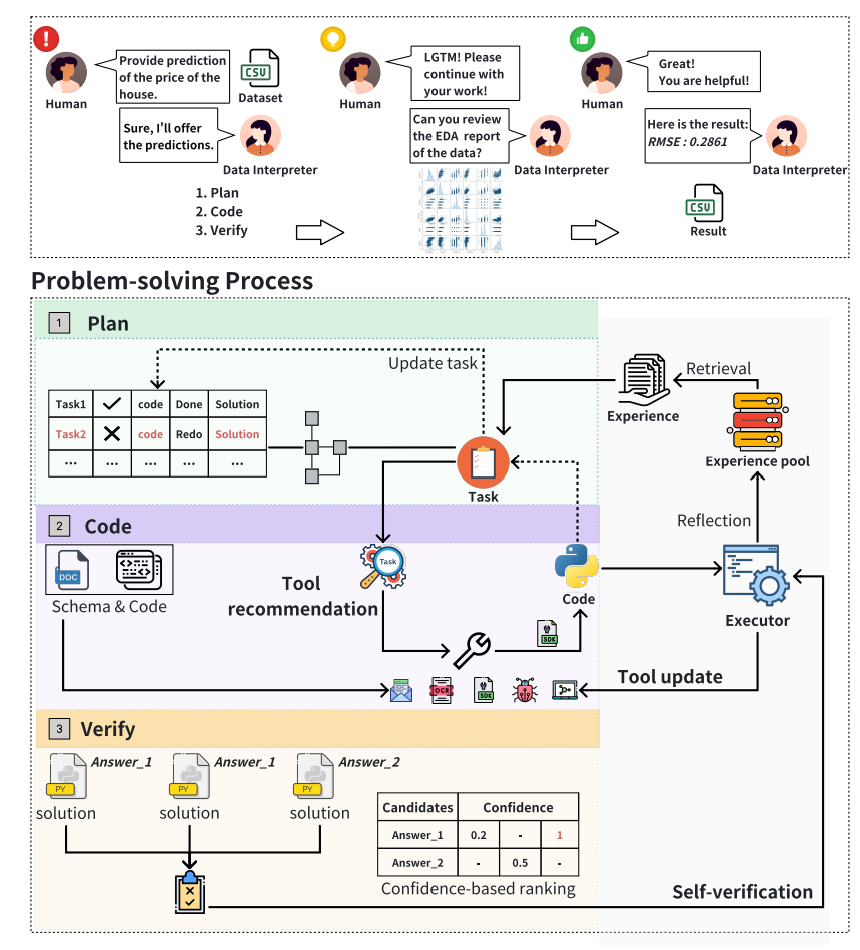
また、Data Interpreterのフレームワークは、基本的に以下の3つの段階で構成されているそう。
- データサイエンスのタスク実行に対する計画を策定し、動的計画グラフを用いた各タスクの状態を管理
- 問題解決に適したツールの選択または作成
- 投票による上記のアクションに対する検証
Data Interpreterの公開以前に、相当話題になった自律型エージェントのDavinについては、「【Devin】未来の技術が到来!完全自立型の生成AIソフトウェアエンジニアが登場」を合わせてご確認ください。
Data Interpreterのライセンス
公式ページによると、MITライセンスのもと無料で商用利用することが可能です。
| 利用用途 | 可否 |
|---|---|
| 商用利用 | ⭕️ |
| 改変 | ⭕️ |
| 配布 | ⭕️ |
| 特許使用 | 記載なし |
| 私的使用 | ⭕️ |

Data Interpreterの使い方
公式のGitリポジトリには、Data Interpreterの具体的な使い方は載っていなかったので、MetaGPTのリポジトリとクイックスタートページを手掛かりに、Google Colab上で実行していきます。
まずは、以下のコードを実行して、metagptライブラリのインストールを済ませましょう。
!pip install metagptここで一旦、ランタイムの再起動が入ります。次に、以下のコマンドを実行してください。
!git clone https://github.com/geekan/MetaGPT.git
%cd MetaGPT

!metagpt --init-config次に、以下のコマンドを実行して、/root/.metagpt/config2.yamlの7行目の「YOUR_API_KEY」の部分を、OpenAIのAPIキーに設定します。「Open AI API Key」の部分に、自身のAPIキーを設定してください。
%cd ../../root/.metagpt/

%%bash
sed -i -e "s/YOUR_API_KEY/OpenAI API Key/g" config2.yaml
cat -n config2.yaml

%cd ../../content/MetaGPT/最後に、以下のコマンドを実行すると、「MetaGPT/examples/di/data_visualization.py」のPythonコードが実行され、Data Interpreterが自動でデータ可視化を行ってくれます。
!python examples/di/data_visualization.py実行した後の様子は、以下の通りです。
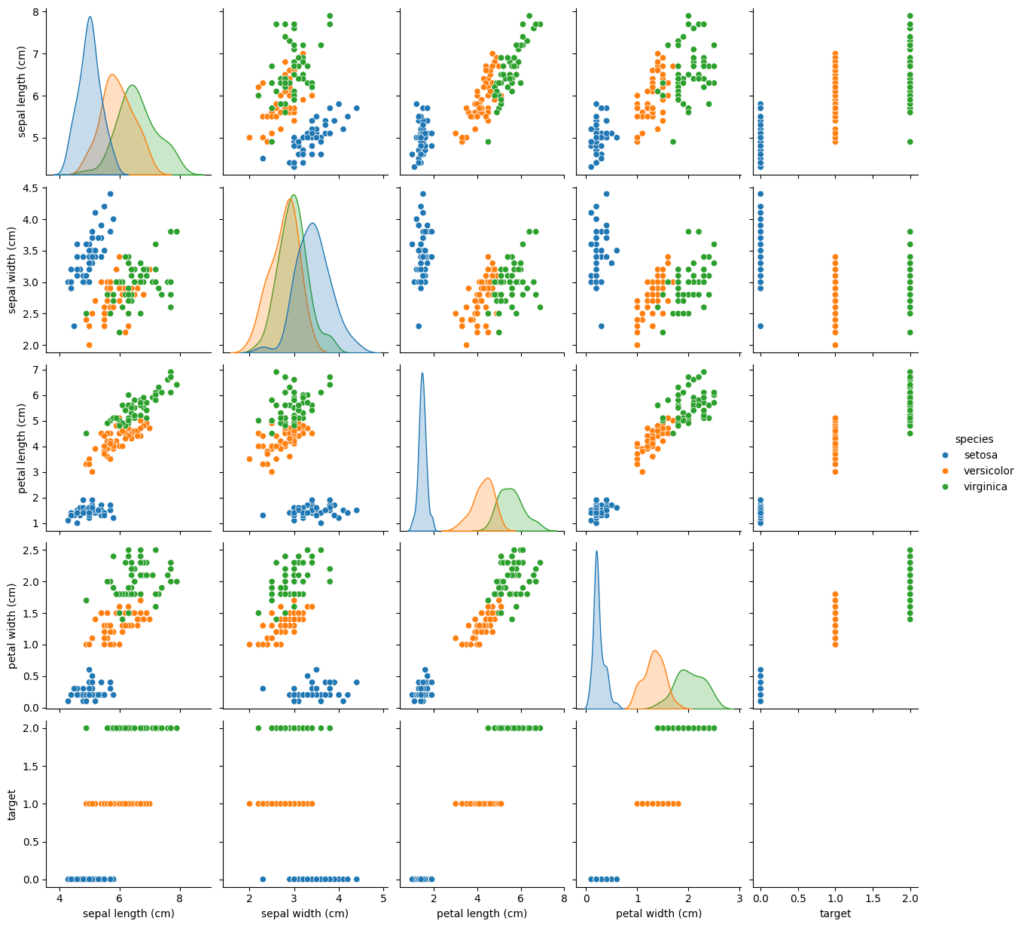
実行完了した後は、「/tmp/tmpvwq9p6bq.PNG」に可視化の図が入っています。
ちなみに、「MetaGPT/examples/di/data_visualization.py」の中身は、以下の通りです。
import asyncio

from metagpt.roles.di.data_interpreter import DataInterpreter


async def main(requirement: str = ""):
    di = DataInterpreter()
    await di.run(requirement)


if __name__ == "__main__":
    requirement = "Run data analysis on sklearn Iris dataset, include a plot"

    asyncio.run(main(requirement))
おそらく12行目の「requirement = “Run data analysis on sklearn Iris dataset, include a plot”(sklearnのIrisデータセットを可視化して)」の部分が、プロンプトになるのかと思われます。
Data Interpreterを動かすのに必要なPCのスペック
■Pythonのバージョン
Python 3.9以上
■使用ディスク量
1.07GB
■RAMの使用量
1.4GB
ちなみに、テキストと画像のプロンプトを、React UIに変換するオープンソースのAIエージェントについては、「【Vercel AI SDK 3.0 】複雑な質問を図解でわかりやすく説明してくれるAIエージェントを使ってみた」を合わせてご確認ください。
機会学習モデリングと数学の推論能力をGPT-4と比較した
ここでは、Data Interpreterで載っていた以下の2つのタスクを、GPT-4と比較してみます。
- Machine Learning Modeling
- Solve mathematical problems
それでは順番に見ていきましょう。
Machine Learning Modeling
ここでは、Data InterpreterのMachine Learning Modelingのページを参考に、sklearnのワインの識別のためのデータセットで、分類モデルを構築してもらいます。
!python examples/di/machine_learning.pyData Interpreterの実行の様子は、以下の通りです。
Data Interpreterが生成したコードは、以下の通りです。
from sklearn.datasets import load_wine
wine_data = load_wine()
print('Dataset loaded successfully.')

import pandas as pd
import matplotlib.pyplot as plt
import seaborn as sns

# Convert the dataset to a DataFrame for easier manipulation
wine_df = pd.DataFrame(data=wine_data.data, columns=wine_data.feature_names)
wine_df['target'] = wine_data.target

# Display basic info and statistics
print(wine_df.info())
print(wine_df.describe())

# Plotting data distribution
plt.figure(figsize=(20, 15))
for i, col in enumerate(wine_df.columns[:-1], 1):
     plt.subplot(4, 4, i)
     sns.histplot(wine_df[col], kde=True, stat="density", linewidth=0)
     plt.title(col)
plt.tight_layout()
plt.show()

from sklearn.model_selection import train_test_split

# Splitting the dataset into training and validation sets
X_train, X_test, y_train, y_test = train_test_split(wine_data.data, wine_data.target, test_size=

print("Dataset split into training and validation sets successfully.")

from sklearn.ensemble import RandomForestClassifier

# Training a RandomForestClassifier
model = RandomForestClassifier(random_state=42)
model.fit(X_train, y_train)

print("Model trained successfully.")

from sklearn.metrics import accuracy_score

# Predicting the validation set results
y_pred = model.predict(X_test)

# Calculating the accuracy
accuracy = accuracy_score(y_test, y_pred)
print(f'Validation accuracy: {accuracy:.2f}')
Validation accuracyは100%を達成しました。
同様のプロンプトをGPT-4に投げたところ、以下のコードを生成しました。
from sklearn.datasets import load_wine
import pandas as pd
import matplotlib.pyplot as plt
from sklearn.model_selection import train_test_split
from sklearn.ensemble import RandomForestClassifier
from sklearn.metrics import accuracy_score

# Load the Wine recognition dataset
wine = load_wine()
wine_df = pd.DataFrame(data=wine.data, columns=wine.feature_names)
wine_df['target'] = wine.target

# Basic data analysis
wine_df.describe()

# Visualization: let's plot a histogram for the distribution of alcohol content
plt.figure(figsize=(10, 6))
plt.hist(wine_df['alcohol'], bins=20, color='skyblue')
plt.title('Distribution of Alcohol Content in Wines')
plt.xlabel('Alcohol Content (%)')
plt.ylabel('Frequency')
plt.grid(True)
plt.show()

# Splitting the dataset into training and validation sets
X_train, X_val, y_train, y_val = train_test_split(wine.data, wine.target, test_size=0.2, random_state=42)

# Training a RandomForestClassifier model
model = RandomForestClassifier(random_state=42)
model.fit(X_train, y_train)

# Predicting on the validation set
y_pred = model.predict(X_val)

# Calculating the accuracy on the validation set
accuracy = accuracy_score(y_val, y_pred)
accuracy
こちらもvalidation testで100%を達成しました。
Solve mathematical problems
ここでは、Data interpreterのSolve Mathematical Problemsのページを参考に、以下の数学の推論問題を解いてもらいます。
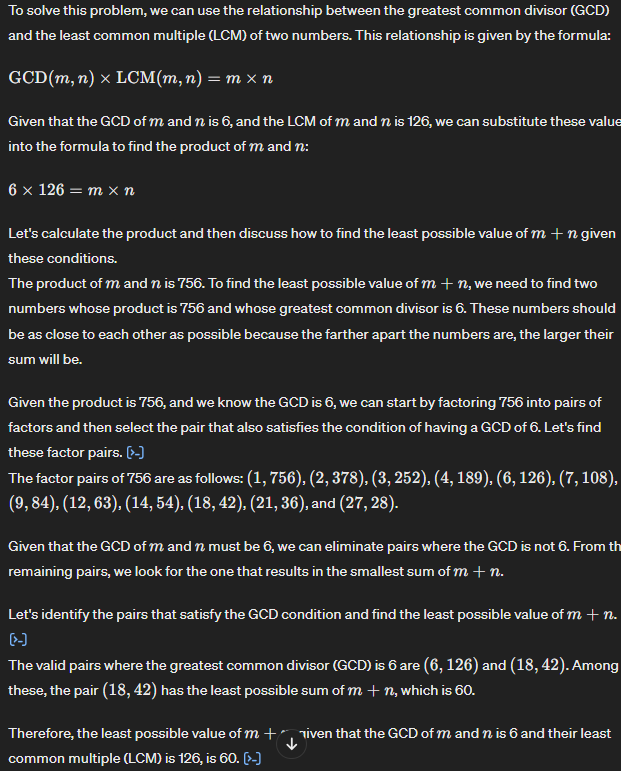
Solve this math problem: The greatest common divisor of positive integers m and n is 6. The least common multiple of m and n is 126. What is the least possible value of m + n?
和訳:
mとnの最小公倍数は126である。m + nの最小値はいくらか。
この問題の答えは、m = 18, n = 42で「60」です。
Data Interpreterの実行の様子は、以下の通りです。
以下のコードを実行することで、見事に60という答えを導いています。
gcd = 6
lcm = 126

# Applying the formula GCD(m, n) * LCM(m, n) = m * n
gcd_lcm_product = gcd * lcm

gcd_lcm_product

gcd = 6
lcm = 126
product = 756

# Function to find all pairs of positive integers (m, n) with a given product and GCD of 6
def find_pairs(product, gcd):
     pairs = []
     for m in range(1, product + 1):
         if product % m == 0:  # m is a divisor of the product
             n = product // m
             if m % gcd == 0 and n % gcd == 0:  # Both m and n are divisible by gcd
                 pairs.append((m, n))
     return pairs

# Find pairs and calculate m + n for each pair
pairs = find_pairs(product, gcd)
sums = [sum(pair) for pair in pairs]

pairs, sums

sums = [132, 60, 60, 132]

# Identify the pair with the least sum of m + n
least_sum = min(sums)

least_sum
同様のプロンプトをGPT-4に投げたところ、以下の出力を生成しました。
こちらも60という正解を出力しました。
このようなデータ分析AIエージェントを自社開発したい方は、以下の記事もご覧ください。

エンジニアが不要になる時代はもう近い?
本記事では、データ解析関連のタスクを解決するためのコードを書くAIエージェントの「Data Interpreter」をご紹介しました。ユーザーが自然言語で指示を出すだけで、それに基づいて自律的にタスクを実行してくれます。
開発元のMetaGPTも、公式Xで「新しいプログラミング言語は英語だ」と述べている通り、テキスト指示だけでコーディングが完了する時代も近いのだと予感させてくれます。
ただ、検証でGPT-4と比較してみましたが、精度や処理の流れとしてはData InterpreterとGPT-4でそこまで違いが無いように見えました。Data Interpreterがユーザーの指示をもとにコードを生成・実行しながら処理をしますが、それと同様の流れでGPT-4も処理を行います。
そのため、Data InterpreterとGPT-4を比べた時、個人的にはGPT-4の方が使いやすくておすすめです。
ちなみに、ある日本人Xユーザーによると、「ポテンシャルは感じるが、どこまで実用的だろうか。実務でも試していきたい。」とのこと。
最後に
いかがだったでしょうか?
GPT-3.5 Turboの最新アップデートで、より高速かつ低コストでのAI活用が可能になりました。自社での導入・活用を検討する際に、最適なモデル選定や活用方法について、一緒に考えてみませんか?
弊社では
・マーケティングやエンジニアリングなどの専門知識を学習させたAI社員の開発
・要件定義・業務フロー作成を80%自動化できる自律型AIエージェントの開発
・生成AIとRPAを組み合わせた業務自動化ツールの開発
・社内人事業務を99%自動化できるAIツールの開発
・ハルシネーション対策AIツールの開発
・自社専用のAIチャットボットの開発
などの開発実績がございます。
まずは、「無料相談」にてご相談を承っておりますので、ご興味がある方はぜひご連絡ください。
➡︎生成AIを使った業務効率化、生成AIツールの開発について相談をしてみる。

「生成AIを社内で活用したい」「生成AIの事業をやっていきたい」という方に向けて、生成AI社内セミナー・勉強会をさせていただいております。
セミナー内容や料金については、ご相談ください。
また、サービス紹介資料もご用意しておりますので、併せてご確認ください。